Data science for cybersecurity: A probabilistic time series model for detecting RDP inbound brute force attacks
Credit to Author: Eric Avena| Date: Wed, 18 Dec 2019 18:00:24 +0000
Computers with Windows Remote Desktop Protocol (RDP) exposed to the internet are an attractive target for adversaries because they present a simple and effective way to gain access to a network. Brute forcing RDP, a secure network communications protocol that provides remote access over port 3389, does not require a high level of expertise or the use of exploits; attackers can utilize many off-the-shelf tools to scan the internet for potential victims and leverage similar such tools for conducting the brute force attack.
Attackers target RDP servers that use weak passwords and are without multi-factor authentication, virtual private networks (VPNs), and other security protections. Through RDP brute force, threat actor groups can gain access to target machines and conduct many follow-on activities like ransomware and coin mining operations.
In a brute force attack, adversaries attempt to sign in to an account by effectively using one or more trial-and-error methods. Many failed sign-ins occurring over very short time frequencies, typically minutes or even seconds, are usually associated with these attacks. A brute force attack might also involve adversaries attempting to access one or more accounts using valid usernames that were obtained from credential theft or using common usernames like “administrator”. The same holds for password combinations. In detecting RDP brute force attacks, we focus on the source IP address and username, as password data is not available.
In the Windows operating system, whenever an attempted sign-in fails for a local machine, Event Tracing for Windows (ETW) registers Event ID 4625 with the associated username. Meanwhile, source IP addresses connected to RDP can be accessed; this information is very useful in assessing if a machine is under brute force attack. Using this information in combination with Event ID 4624 for non-server Windows machines can shed light on which sign-in sessions were successfully created and can further help in detecting if a local machine has been compromised.
In this blog we’ll present a study and a detection logic that uses these signals. This data science-driven approach to detecting RDP brute force attacks has proven valuable in detecting human adversary activity through Microsoft Threat Experts, the managed threat hunting service in Microsoft Defender Advanced Threat Protection. This work is an example of how the close collaboration between data scientists and threat hunters results in protection for customers against real-world threats.
Insights into brute force attacks
Observing a sudden, relatively large count of Event ID 4625 associated with RDP network connections might be rare, but it does not necessarily imply that a machine is under attack. For example, a script that performs the following actions would look suspicious looking at a time series of counts of failed sign-in but is most likely not malicious:
- uses an expired password
- retries sign-in attempts every N-minutes with different usernames
- over a public IP address within a range owned by the enterprise
In contrast, behavior that includes the following is indicative of an attack:
- extreme counts of failed sign-ins from many unknown usernames
- never previously successfully authenticated
- from multiple RDP connections
- from new source IP addresses
Understanding the context of failed sign-ins and inbound connections is key to discriminating between true positive (TP) and false positive (FP) brute force attacks, especially if the goal is to automatically raise only high-precision alerts to the appropriate recipients, as we do in Microsoft Defender ATP.
We analyzed several months’ worth of data to mine insights into the types of RDP brute force attacks occurring across Microsoft Defender ATP customers. Out of about 45,000 machines that had both RDP public IP connections and at least 1 network failed sign-in, we discovered that, on average, several hundred machines per day had high probability of undergoing one or more RDP brute force attack attempts. Of the subpopulation of machines with detected brute force attacks, the attacks lasted 2-3 days on average, with about 90% of cases lasting for 1 week or less, and less than 5% lasting for 2 weeks or more.
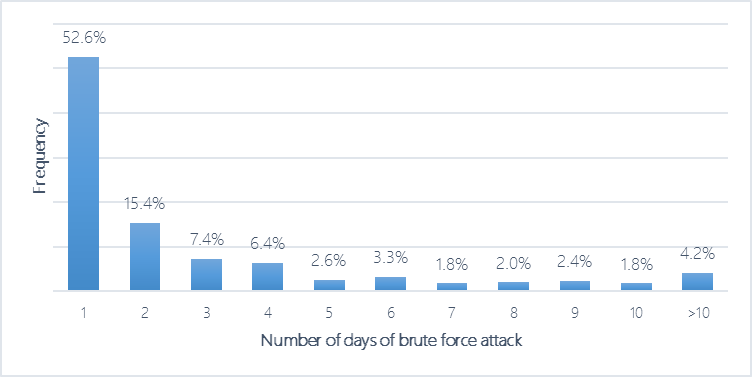
Figure 1: Empirical distribution in number of days per machine where we observed 1 or more brute force attacks
As discussed in numerous other studies [1], large counts of failed sign-ins are often associated with brute force attacks. Looking at the count of daily failed sign-ins, 90% of cases exceeded 10 attempts, with a median larger than 60. In addition, these unusual daily counts had high positive correlation with extreme counts in shorter time windows (see Figure 2). In fact, the number of extreme failed sign-ins per day typically occurred under 2 hours, with about 40% failing in under 30 minutes.
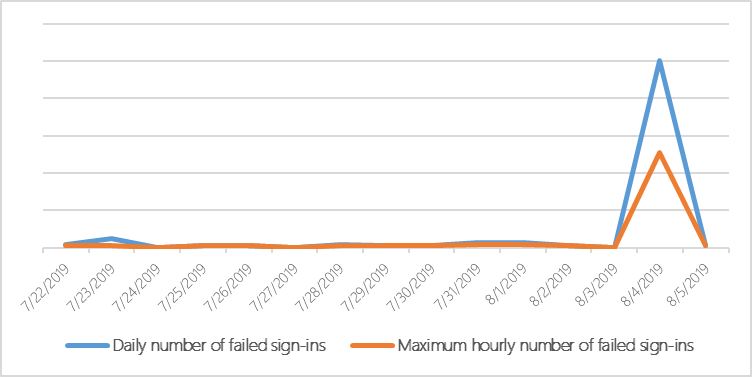
Figure 2: Count of daily and maximum hourly network failed sign-ins for a local machine under brute force attack
While a detection logic based on thresholding the count of failed sign-ins during daily or finer grain time window can detect many brute force attacks, this will likely produce too many false positives. Worse, relying on just this will yield false negatives, missing successful enterprise compromises: our analysis revealed several instances where brute force attacks generated less than 5-10 failed attempts at a daily granularity but often persisted for many days, thereby avoiding extreme counts at any point in time. For such a brute force attack, thresholding the cumulative number of failed sign-ins across time could be more useful, as depicted in Figure 3.
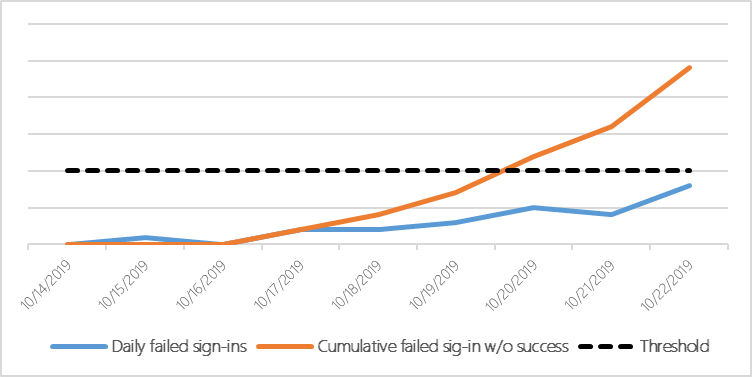
Figure 3: Daily and cumulative failed network sign-in
Looking at counts of network failed sign-ins provides a useful but incomplete picture of RDP brute force attacks. This can be further augmented with additional information on the failed sign-in, such as the failure reason, time of day, and day of week, as well as the username itself. An especially strong signal is the source IP of the inbound RDP connection. Knowing if the external IP has a high reputation of abuse, as can be looked up on sites like https://www.abuseipdb.com/, can directly confirm if an IP is a part of an active brute force.
Unfortunately, not all IP addresses have a history of abuse; in addition, it can be expensive to retrieve information about many external IP addresses on demand. Maintaining a list of suspicious IPs is an option, but relying on this can result in false negatives as, inevitably, new IPs continually occur, particularly with the adoption of cloud computing and ease of spinning up virtual machines. A generic signal that can augment failed sign-in and user information is counting distinct RDP connections from external IP addresses. Again, extreme values occurring at a given time or cumulated over time can be an indicator of attack.
Figure 4 shows histograms (i.e., counts put into discrete bins) of daily counts of RDP public connections per machine that occurred for an example enterprise with known brute force attacks. It’s evident that normal machines have a lower probability of larger counts compared to machines attacked.

Figure 4: Histograms of daily count of RDP inbound across machines for an example enterprise
Given that some enterprises have machines under brute force attack daily, the priority may be to focus on machines that have been compromised, defined by a first successful sign-in following failed attempts from suspicious source IP addresses or unusual usernames. In Windows logs, Event ID 4624 can be leveraged to measure successful sign-in events for local machine in combination with failed sign-ins (Event ID 4625).
Out of the hundreds of machines with RDP brute force attacks detected in our analysis, we found that about .08% were compromised. Furthermore, across all enterprises analyzed over several months, on average about 1 machine was detected with high probability of being compromised resulting from an RDP brute force attack every 3-4 days. Figure 5 shows a bubble chart of the average abuse score of external IPs associated with RDP brute force attacks that successfully compromised machines. The size of the bubbles is determined by the count of distinct machines across the enterprises analyzed having a network connection from each IP. While there is diversity in the origin of the source IPs, Netherlands, Russia, and the United Kingdom have a larger concentration of inbound RDP connections from high-abuse IP.
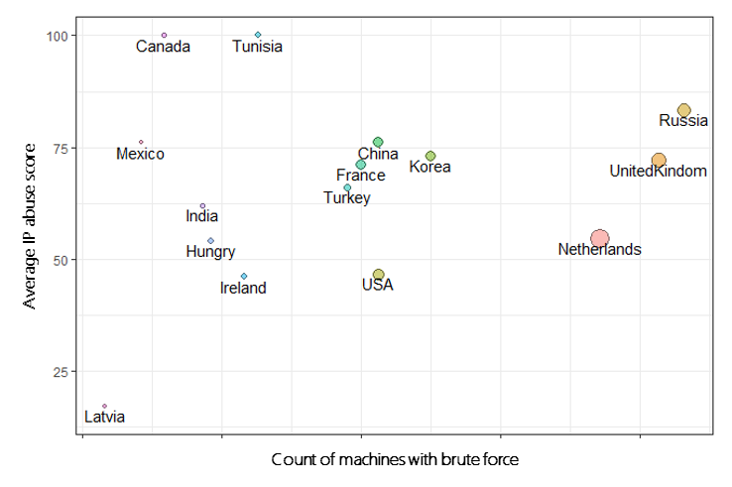
Figure 5: Bubble chart of IP abuse score versus counts of machine with inbound RDP
A key takeaway from our analysis is that successful brute force attempts are not uncommon; therefore, it’s critical to monitor at least the suspicious connections and unusual failed sign-ins that result in authenticated sign-in events. In the following sections we describe a methodology to do this. This methodology was leveraged by Microsoft Threat Experts to augment threat hunting and resulted in new targeted attack notifications.
Combining many relevant signals
As discussed earlier (with the example of scripts connecting via RDP using outdated passwords yielding failed sign-ins), simply relying on thresholding failed attempts per machine for detecting brute force attacks can be noisy and may result in many false positives. A better strategy is to utilize many contextually relevant signals, such as:
- the timing, type, and count of failed sign-in
- username history
- type and frequency of network connections
- first-time username from a new source machine with a successful sign-in
This can be even further extended to include indicators of attack associated with brute force, such as port scanning.
Combining multiple signals along the attack chain has been proposed and shown promising results [2]. We considered the following signals in detecting RDP inbound brute force attacks per machine:
- hour of day and day of week of failed sign-in and RDP connections
- timing of successful sign-in following failed attempts
- Event ID 4625 login type (filtered to network and remote interactive)
- Event ID 4625 failure reason (filtered to %%2308, %%2312, %%2313)
- cumulative count of distinct username that failed to sign in without success
- count (and cumulative count) of failed sign-ins
- count (and cumulative count) of RDP inbound external IP
- count of other machines having RDP inbound connections from one or more of the same IP
Unsupervised probabilistic time series anomaly detection
For many cybersecurity problems, including detecting brute force attacks, previously labeled data is not usually available. Thus, training a supervised learning model is not feasible. This is where unsupervised learning is helpful, enabling one to discover and quantify unknown behaviors when examples are too sparse. Given that several of the signals we consider for modeling RDP brute force attacks are inherently dependent on values observed over time (for example, daily counts of failed sign-ins and counts of inbound connections), time series models are particularly beneficial. Specifically, time series anomaly detection naturally provides a logical framework to quantify uncertainty in modeling temporal changes in data and produce probabilities that then can be ranked and thresholded to control a desirable false positive rate.
Time series anomaly detection captures the temporal dynamics of signals and accurately quantifies the probability of observing values at any point in time under normal operating conditions. More formally, if we introduce the notation Y(t) to denote the signals taking on values at time t, then we build a model to compute reliable estimates of the probability of Y(t) exceeding observed values given all known and relevant information, represented by P[y(t)], sometimes called an anomaly score. Given a false positive tolerance rate r (e.g., .1% or 1 out of 10,000 per time), for each time t, values y*(t) satisfying P[y*(t)] < r would be detected as anomalous. Assuming the right signals reflecting the relevant behaviors of the type of attacks are chosen, then the idea is simple: the lowest anomaly scores occurring per time will be likely associated with the highest likelihood of real threats.
For example, looking back at Figure 2, the time series of daily count of failed sign-ins occurring on the brute force attack day 8/4/2019 had extreme values that would be associated with an empirical probability of about .03% out of all machine and days with at least 1 failed network sign-in for the enterprise.
As discussed earlier, applying anomaly detection to 1 or a few signals to detect real attacks can yield too many false positives. To mitigate this, we combined anomaly scores across eight signals we selected to model RDP brute force attack patterns. The details of our solution are included in the Appendix, but in summary, our methodology involves:
- updating statistical discrete time series models sequentially for each signal, capturing time of day, day of week, and both point and cumulative effects
- combining anomaly scores using an approach that yields accurate probability estimates, and
- ranking the top N anomalies per day to control a desired number of false positives
Our approach to time series anomaly detection is computationally efficient, automatically learns how to update probabilities and adapt to changes in data.
As we describe in the next section, this approach has yielded successful attack detection at high precision.
Protecting customers from real-word RDP brute force attacks through Microsoft Threat Experts
The proposed time series anomaly detection model was deployed and utilized by Microsoft Threat Experts to detect RDP brute force attacks during threat hunting activities. A list that ranks machines across enterprises with the lowest anomaly scores (indicating the likelihood of observing a value at least as large under expected conditions in all signals considered) is updated and reviewed every day. See Table 1 for an example.
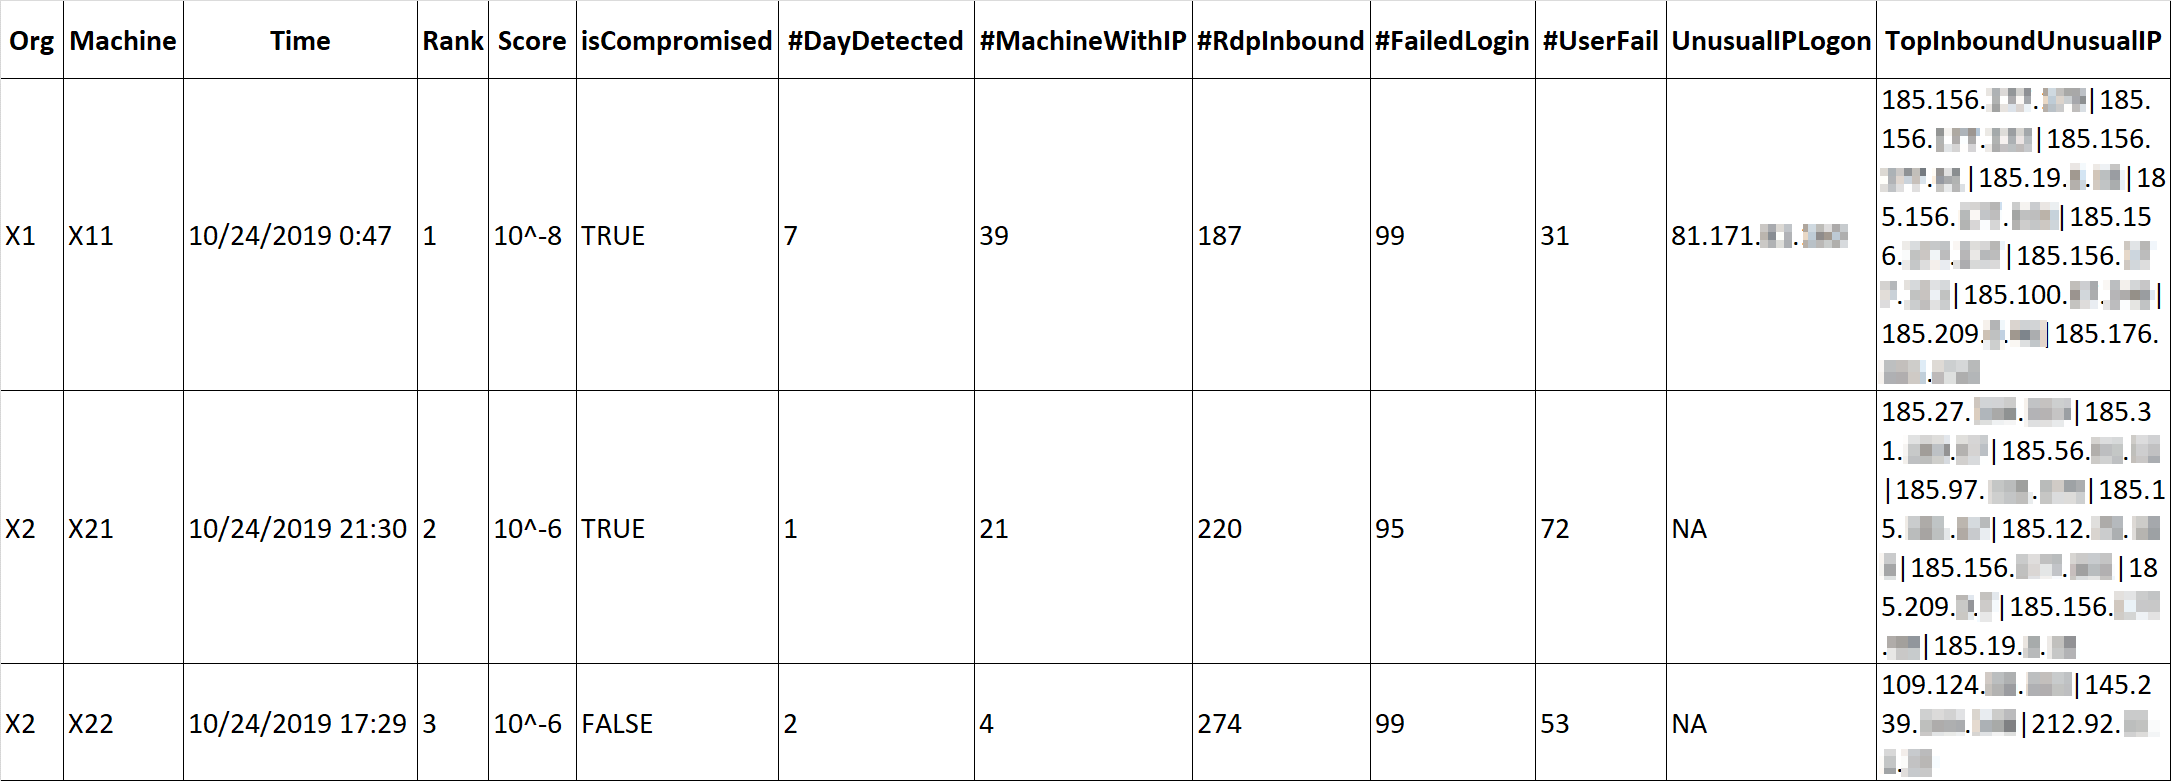
Table 1: Sample ranking of detected RDP inbound brute force attacks
For each machine with detection of a probable brute force attack, each instance is assigned TP, FP, or unknown. Each TP is then assigned priority based on the severity of the attack. For high-priority TP, a targeted attack notification is sent to the associated organization with details about the active brute force attack and recommendations for mitigating the threat; otherwise the machine is closely monitored until more information is available.
We also added an extra capability to our anomaly detection: automatically sending targeted attack notifications about RDP brute force attacks, in many cases before the attack succeeds or before the actor is able to conduct further malicious activities. Looking at the most recent sample of about two weeks of graded detections, the average precision per day (i.e., true positive rate) is approximately 93.7% at a conservative false positive rate of 1%.
In conclusion, based on our careful selection of signals found to be highly associated with RDP brute force attacks, we demonstrated that proper application of time series anomaly detection can be very accurate in identifying real threats. We have filed a patent application for this probabilistic time series model for detecting RDP inbound brute force attacks. In addition, we are working on integrating this capability into Microsoft Defender ATP’s endpoint and detection response capabilities so that the detection logic can raise alerts on RDP brute force attacks in real-time.
Monitoring suspicious activity in failed sign-in and network connections should be taken seriously—a real-time anomaly detection capable of self-updating with the changing dynamics in a network can indeed provide a sustainable solution. While Microsoft Defender ATP already has many anomaly detection capabilities integrated into its EDR capabilities, we will continue to enhance these detections to cover more security scenarios. Through data science, we will continue to combine robust statistical and machine learning approaches with threat expertise and intelligence to deliver industry-leading protection to our customers.
Cole Sodja, Justin Carroll, Joshua Neil
Microsoft Defender ATP Research Team
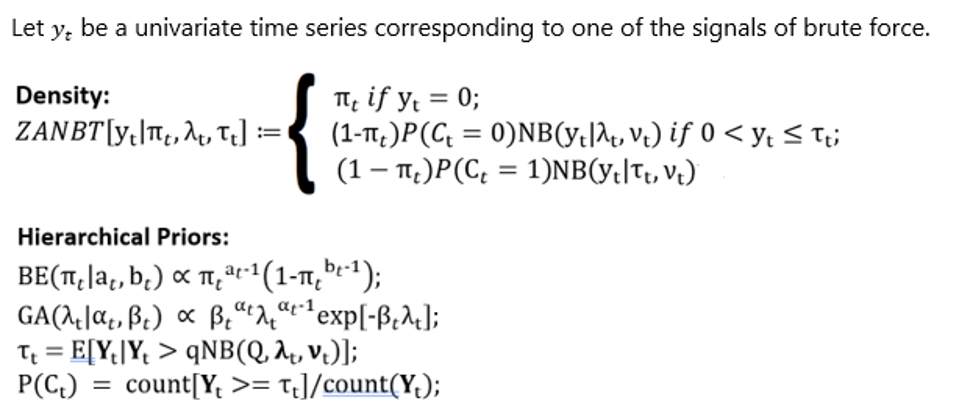
Appendix 1: Models formulation
We utilize hierarchical zero-adjusted negative binomial dynamic models to capture the characteristics of the highly discrete count time series. Specifically, as shown in Figure 2, it’s expected that most of the time there won’t be failed sign-ins for valid credentials on a local machine; hence, there are excess zeros that would not be explained by standard probability distributions such as the negative binomial. In addition, the variance of non-zero counts is often much larger than the mean, where for example, valid scripts connecting via RDP can generate counts in the 20s or more over several minutes because of an outdated password. Moreover, given a combination of multiple users or scripts connecting to shared machines at the same time, this can generate more extreme counts at higher quantiles resulting in heavier tails, as seen in Figure 6.
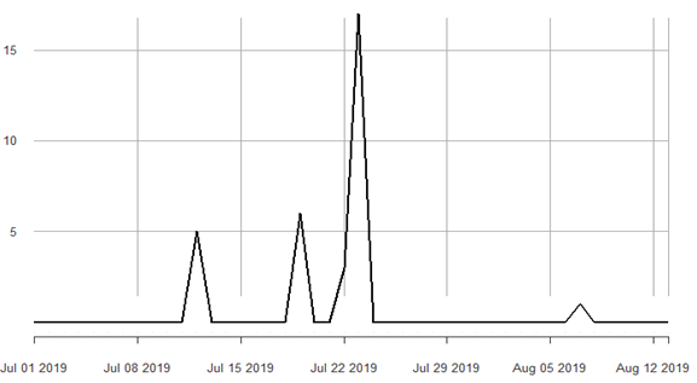
Figure 6: Daily count of network failed sign-in for a machine with no brute force attack
Parametric discrete location/scale distributions do not generate well-calibrated p-values for rare time series, as seen in Figure 6, and thus if used to detect anomalies can result in too many FPs when looking across many machines at high time frequencies. To overcome this challenge dealing with the sparse time series of counts of failed sign-in and RDP inbound public connections we specify a mixture model, where, based on our analysis, a zero-inflated two-component negative binomial distribution was adequate.
Our formulation is based on thresholding values that determine when to transition to a distribution with larger location and/or scale as given in Equation 1. Hierarchical priors are given from empirical estimates of the sample moments across machines using about 1 month of data.
Equation 1: Zero-adjusted negative binomial threshold model
Negative binomial distribution (NB):
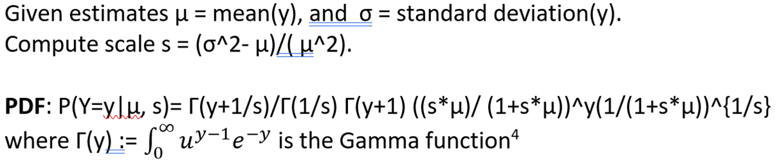
To our knowledge, this formulation does not yield a conjugate prior, and so directly computing probabilities from the posterior predicted density is not feasible. Instead, anomaly scores are generated based on drawing samples from all distributions and then computing the empirical right-tail p-value.
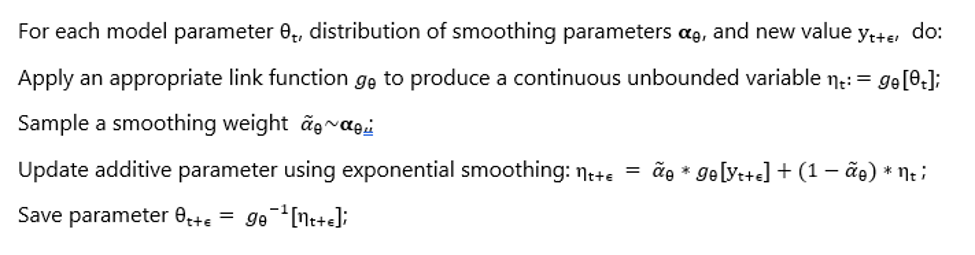
Updating parameters is done based on applying exponential smoothing. To avoid outliers skewing estimates, such as machines under brute force or other attacks, trimming is applied to sample from the distribution at a specified false positive rate, which was set to .1% for our study. Algorithm 1 outlines the logic.
The smoothing parameters were learned based on maximum likelihood estimation and then fixed during each new sequential update. To induce further uncertainty, bootstrapping across machines is done to produce a histogram of smoothing weights, and samples are drawn in accordance to their frequency. We found that weights concentrated away from 0 vary between .06% and 8% for over 90% of machines, thus leading to slow changes in the parameters. An extension using adaptive forgetting factors will be considered in future work to automatically learn how to correct smoothing in real time.
Algorithm 1: Updating model parameters real-time
Appendix 2: Fisher Combination
For a given device, for each signal that exists a score is computed defined as a p-value, where lower values are associated with higher likelihood of being an anomaly. Then the p-values are combined to yield a joint score across all signals based on using the Fisher p-value combination method as follows:
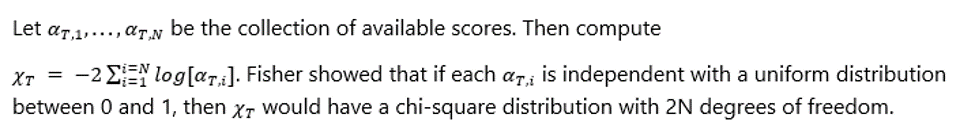
The use of Fisher’s test applied to anomaly scores produces a scalable solution that yields interpretable probabilities that thus can be controlled to achieve a desired false positive rate. This has even been applied in a cybersecurity context. [3]
[1] Najafabadi et al, Machine Learning for Detecting Brute Force Attacks at the Network Level, 2014 IEEE 14th International Conference on Bioinformatics and Bioengineering
[2] Sexton et al, Attack chain detection, Statistical Analysis and Data Mining, 2015
[3] Heard, Combining Weak Statistical Evidence in Cyber Security, Intelligent Data Analysis XIV, 2015
The post Data science for cybersecurity: A probabilistic time series model for detecting RDP inbound brute force attacks appeared first on Microsoft Security.