How to estimate electrical network stress during large motor starting in pre-design phase
Credit to Author: Jerome Guillet| Date: Thu, 23 Jan 2020 15:21:47 +0000
This post is part of a series of motor management blogs discussing various aspects of large motor integration in the electrical network and industrial process.
In a previous blog post, we learned that simplified calculations can be used to evaluate voltage drop caused by large motor starting and determine potential solutions in the design project stage. Those calculation simplifications are valid if cables can be omitted. The calculations are using only reactances.
Reduced voltage soft starters (RVSS) and variable speed drives (VSD), are commonly used electronic starters for large motors. In this blog post, we will provide guidelines to establish an order of magnitude to determine how RVSS and VSD impact voltage drops compared to using direct online (DOL), which is the most frequently used motor starting solution.
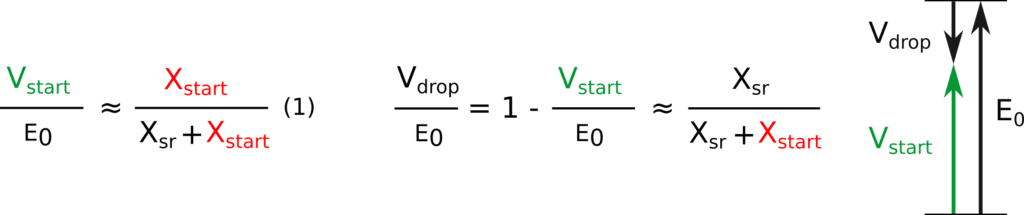
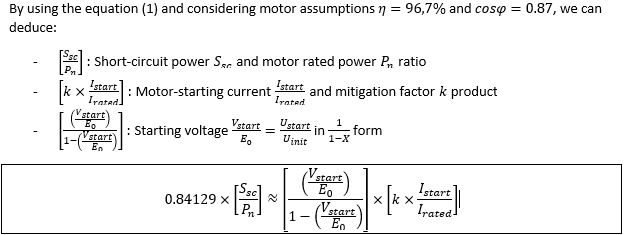
Let’s consider a basic situation with one motor to start. We can express the voltage at motor terminals, i.e. starting voltage as:
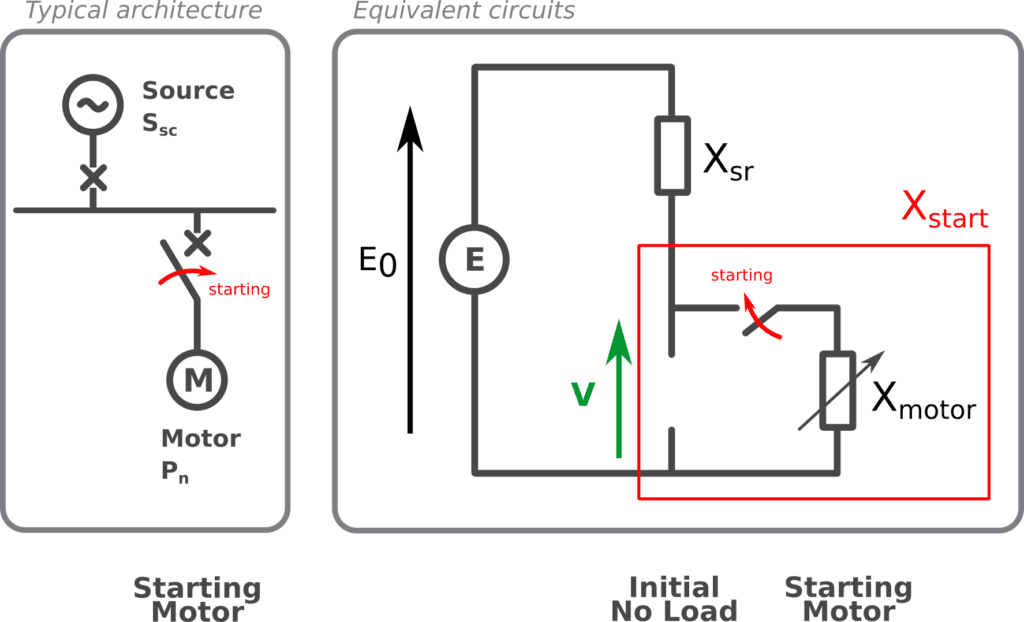
Figure 1 Basic and equivalent electrical diagram of starting motor in network
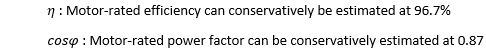
 With,
With,
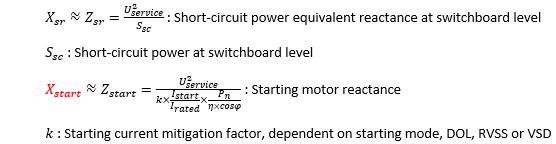
Using a direct online starter results in a full starting current, therefore k=1. When applicable, RVSS can reduce the starting current up to 50% (k=1/2). A variable speed drive starter can reduce the starting current to less than a quarter (k=1/4).
The following figure illustrates the relationship between effective starting current and maximum current for the three starting modes discussed above:
Figure 2 Influence of starting mode on current
This relation can be observed in the following graphical representation and allows the 3 steps for voltage drop estimation to be defined:
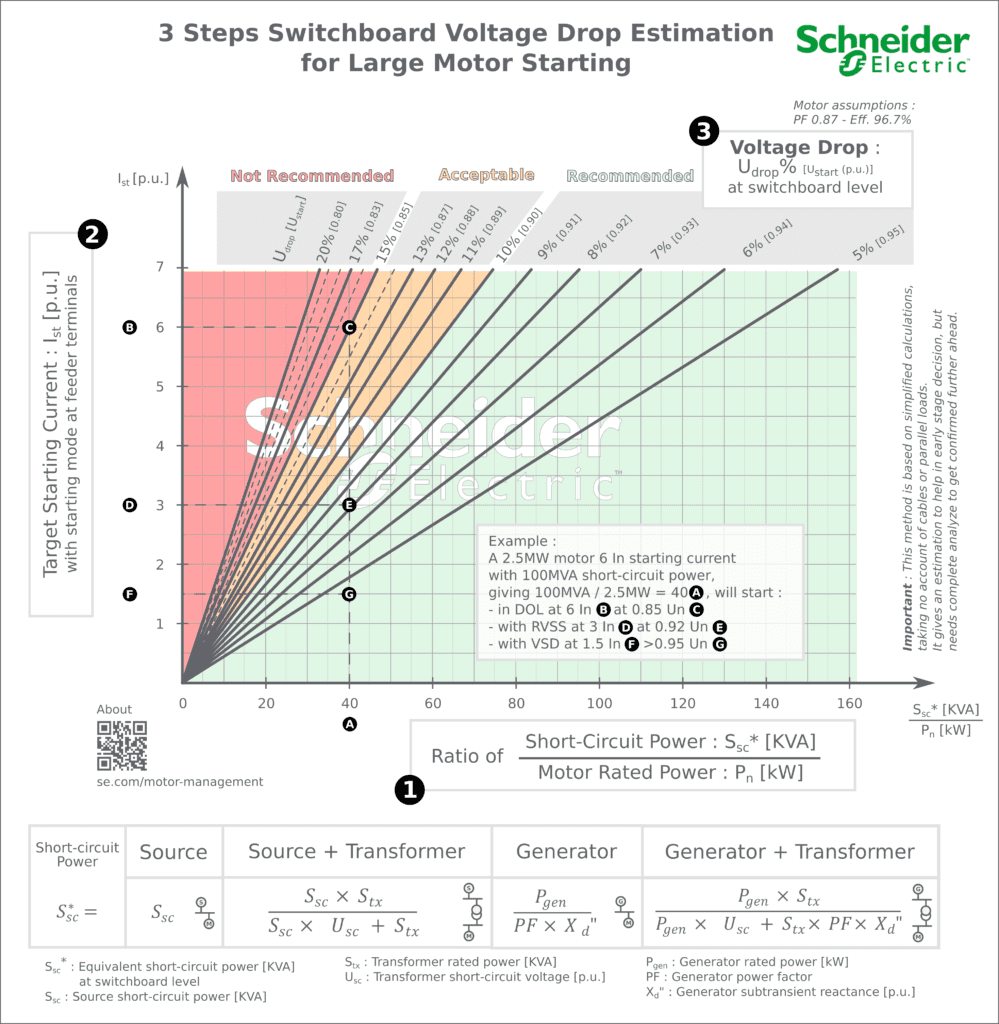
Figure 3 Basic guidelines for voltage drop estimation during motor start
Let’s consider the following example:
Pn = 2.5MW centrifugal pump motor with 6 x In starting current
Ssc =100MVA short-circuit power at motor busbar level.
In step 1, the ratio between short-circuit power and motor rated power has a value of 40 (100MVA/2.5MW), shown as point (A) on the figure.
In step 2, the starting modes and respective prospective starting currents are analyzed. In direct online starting, the motor will start at 6 In (B), RVSS with 3 x In (D) and VSD at 1.5 x In (F).
In step 3, the respective voltage drop for each starting mode is determined by reading the corresponding value from the voltage drop scale. For DOL, the voltage drop corresponding to 6 x In starting current is 15% (C), using RVSS it will be 8% (E) and using VSD it will be less than a 5% voltage drop (G).
![]()
![]()
However, it is important not to confuse this short-circuit current ISC with the busbar short-circuit current rating. Such approximation will lead to an overestimation of short-circuit power and an optimistic calculation of voltage drop, inducing changes in commissioning phase and additional costs.
Using the proposed method, it is easy to discriminate starting methods in early project phase where data is limited and inexact.
Interested to learning more about motor management? Let our expertise be your guide in this free brochure:
Motor Management for LV and MV high-power motor applications

The post How to estimate electrical network stress during large motor starting in pre-design phase appeared first on Schneider Electric Blog.